Content Marketing Analytics Automation at edX
Project Year: 2021-2022
Situation
edX developed a robust content marketing team, comprised of management, strategists, and freelance writers. Many of the internal operations were standardized and basic performance metrics were tracked.
However, much of the analysis was done manually, stunting the ability of the content team to review metrics in real-time and iterate strategy based on data.
Approach
I worked with the content, operations, engineering, and business intelligence teams to automate analytics in order to capture quantitative and qualitative data in real time. I organized the project into four phases:
- Adding informative quantitative metrics
- Outlining automated data tracking
- Expanding analysis
- Integrating modes to capture qualitative data
Phase 1: Adding informative quantitative metrics
Some metrics that the organization tracked did not provide the full picture of user behavior when interacting with edX content. An example would be the time a user spent on a page versus the active time a user spent on a page. We reviewed and added additional metrics to our tracking to ensure that the data we captured fully informed our strategy.
This allowed us to answer some key questions about user behavior that we could then leverage to adjust our approach.
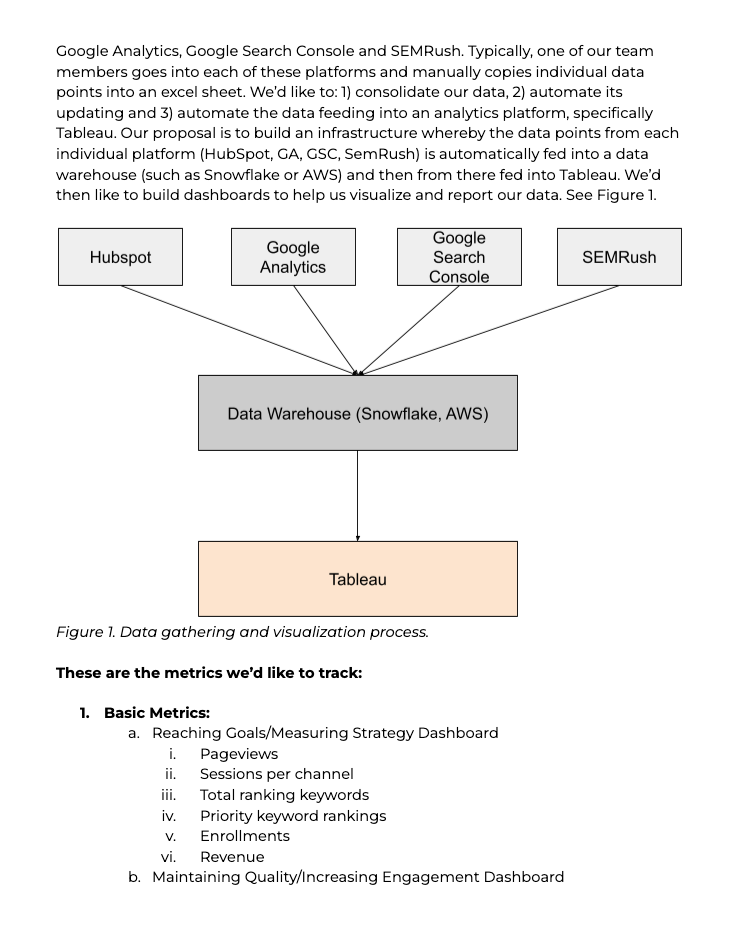
Phase 2: Outlining Automated Data Tracking
I outlined a process through which the organization could capture and store relevant metrics from multiple data sources, and then visualize them with user-friendly software. The aim was to gather and visualize data in real-time, and thus allow the team to make data-driven decisions and share comprehensive reporting with cross-functional teams.
Phase 3: Expanding Analysis
Content marketing for master’s degree programs was a fairly new vertical. We needed a way to visualize performance in an easily-digestible snapshot.
I worked with a data scientist to put together a Sankey Diagram depicting the Google SERP keyword ranking for individual articles in each degree program.
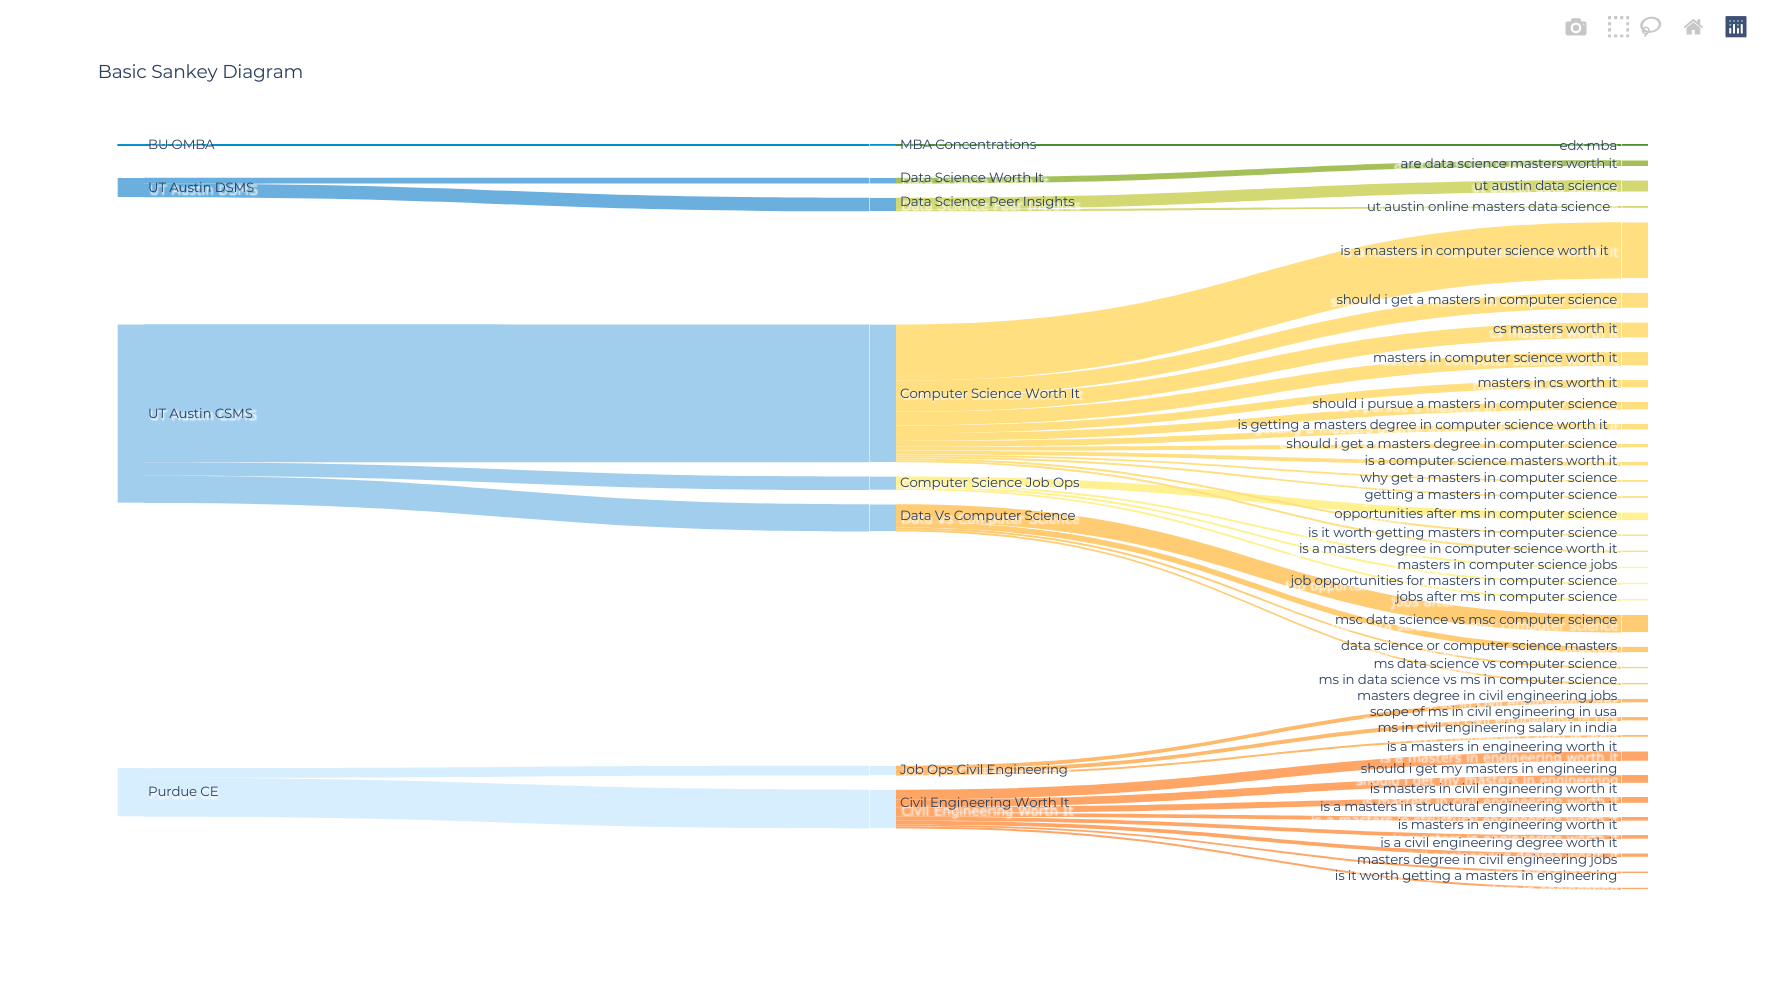
This visualization allowed us to quickly present the success of the marketing efforts to partners and cross-functional teams.
Phase 4: Capturing Qualitative Data
While quantitative data can give us a look into what and how our content marketing is doing, qualitative data can often help us answer why.
At edX, we wanted to get closer to understanding the “why” of our user interactions. So we developed a project that embedded short quizzes into articles that captured direct, active feedback from users.
We then outlined an SOP for analyzing and responding to actionable feedback.
Impact
- Automated insights into content marketing performance
- Capturing targeted metrics that allow us to answer relevant questions about user behavior
- An infrastructure that allows us to capture qualitative data directly from customers, enabling the team to answer the pressing “why”
- An infrastructure that supports data-driven decision-making in content marketing
edX
Online Education Platform
edX is an American massive open online course (MOOC) provider created by Harvard and MIT. It hosts online university-level courses in a wide range of disciplines to a worldwide student body, including some courses at no charge. It also conducts research into learning based on how people use its platform. edX runs on the free Open edX open-source software platform. 2U is the parent company, with edX operating as its global online learning platform and primary brand for products and services.
I worked on the content team at edX prior to and during the 2U acquisition, focusing primarily on content marketing for the platform’s master’s degree programs.
